How to use the Health Poverty Index (HPI) visualisation tool
Introduction
The HPI visualisation tool allows you to view health-related data comparing two different populations. You can visualise the data in a variety of different formats - spider charts (referred to here as the HPI chart), bar-charts, HTML tables and Excel tables - and reuse these tables and charts in your own documents. This Demonstration shows you step-by-step how to use the tool.
HPI Background
The NHS Plan (2000) states that "no injustice is greater than the inequalities in health which scar our nation" and proposes a number of developments to combat this situation. One of these is the production of a Health Poverty Index (HPI). Following the publication of the NHS Plan, The Department of Health (DoH), therefore, commissioned a scoping project to develop the HPI concept, involving a major consultation and a series of discussions within the DoH and between the DoH and other bodies charged with tackling the issue of health inequalities.
Work on the HPI development was initially funded by the DoH and subsequently by the NHS Information Centre. The work was carried out by the Social Disadvantage Research Centre (SDRC) of the Department of Social Policy and Social Work at the University of Oxford and the South East Public Health Observatory (SEPHO). Since September 2004 the work has been carried out by SEPHO, SDRC and the Department of Geography and Geosciences at the University of St Andrews, Scotland.
Health Warning
In order to map out the concept of ‘health poverty’, a large number of innovative variables have been created. Because the object of the project was to provide a graphical summary of the situation of ‘health poverty’, the data development principle applied has been one of maximum access to information rather than maximum precision in the data. If we had not applied this principle, there would have been very few indicators available in the timeframe of the project. We do not believe the data is inaccurate but as with all new indicators, some caution should be applied when using them. We have given full descriptions of how the variables were generated and so the user can judge how much weight they would like to place on any one indicator.
Select your groups
Selecting The HPI Tool navigation link above will bring up the groups page which offers four ways in which groups can be compared:
- Compare an area over time
- Compare 2 areas at the same point in time
- Compare 2 ethnic groups in the same area
- Compare the same ethnic group between 2 areas
When you have selected
the groups you are interested in, click on View HPI Data to
see the groups compared.
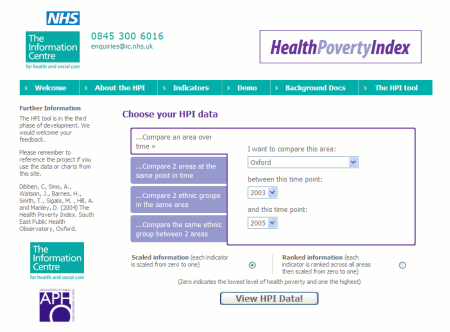
Compare an area over time
By default the system selects Compare an area over time. Oxford is compared over 2 points in time (2003 and 2005). To change the selection, simply click on the arrow key next to the geographical area selected, and select a different area. The areas are listed in alphabetical order.
Similarly, to compare different time points, click on the time point list and select a different year (at present data for 2001, 2003 and 2005 are available).
Compare 2 areas at the same point in time
To compare 2 areas at the same point in time over time, simply select the 2 areas you want to compare and the year.
An area can also be compared to other similar areas by choosing one of the three types of ONS classification areas (supergroup, group or subgroup) to compare it to. For example, if you want to compare Oxford to its ONS supergroup, just select Oxford as the first area and then 'compare with ONS supergroup' as the other. By choosing the ONS classification areas, it is possible to see how much an area deviates in particular aspects of health poverty from similar areas across England. For further details of the ONS classification areas see the About the HPI page.
The ONS classification areas can also be compared with each other. For example, you can compare an average coastal area and an average manufacturing centre.
Comparison with an areas spearhead status is also possible. This can be done be selecting your area, selecting 'compare with spearhead status' and finally selecting the year of interest. You can also compare an average spearhead area with an average non spearhead area.
Compare 2 ethnic groups in the same area
Enables comparison between two ethnic groups in the same area. The groups available for comparison are: White, Pakistani, Bangladeshi, Indian, Chinese, Black African and Black Caribbean. A comparison can also be made between one group and all the groups.
Compare the same ethnic group between 2 areas
Allows the same ethnic group to be compared between two areas.
Once you have selected your groups of interest you can choose to view the information in either scaled or ranked format. Clicking on View HPI Data will then bring up the data in spider-chart format.
The navigation links on the left show the other formats in which the data is available.
Interpreting the data
All data shown in the Health Poverty Index has been scaled so that a score of zero indicates the best situation in terms of health poverty and a score of one indicates the worst situation. In other words, an area with a score near zero for a particular indicator has lower levels of health poverty in that domain than an area with a score near one.
The data is available in two formats, scaled and ranked. In both formats a score of zero indicates the best situation in terms of health poverty and a score of one indicates the worst situation. The scaled data for each indicator shows the linearly scaled indicator - the Local Authority score showing the highest level of health poverty across England for that indicator is given a score of one, while the Local Authority score showing the lowest level of health poverty across England for that indicator is given a score of zero. The ranked data for each indicator shows the linearly scaled ranked indicator - all Local Authorities are ranked on that indicator, and the ranks scaled so that the Local Authority score showing the highest level of health poverty across England for that indicator is given a score of one, while the Local Authority score showing the lowest level of health poverty across England for that indicator is given a score of zero.
For example, the HPI Chart below shows Oxford district over two time periods. The red line shows the district's indicators for 2003 and the blue line for 2005. The chart demonstrates that, not unexpectedly, many of the indicators have changed little over this period. However, there is evidence that resourcing for some of the services that support better health either directly or in the longer term has improved (ie the blue line for 2005 is closer to the centre of the chart indicating a relative improvement). There is also evidence in the human capital and home environments indicators that some of these services are improving over time.
Viewing spider-chart data
Once you have selected your groups and clicked on View HPI data, the navigation links on the left will show the formats in which you can view the HPI data. HPI Chart shows the data in spider-chart format (this is the default format for viewing the data):
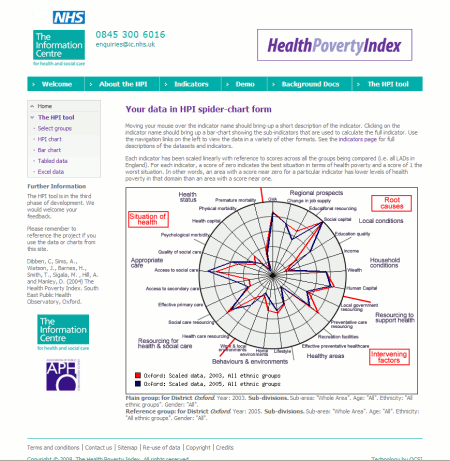
Data for the main (red line) and comparison groups (dark blue line) you defined are shown in the spider-chart, with the 26 health-related indicators shown (see the Indicators or About the HPI pages for further details of the indicators, their components and the datasets used), and the nine sectors labeled. For each indicator, a score of zero indicates the best situation in terms of health poverty and a score of 1 the worst situation. The main and comparison groups are described at the bottom of the page.
Rolling your mouse over the variable name should bring up a short description of that variable (this is not available in all browsers). By ‘left-clicking’ on the indicators a pop-up chart of the components that make up the indicator will appear.
You can save this chart to reuse in your own documents by saving the image. This varies by web-browser, but typically you can right-click on the chart, and select ‘Save image’. The image will be saved in the common jpeg or png formats, which you can then import into your own documents.
Viewing bar-chart data
Once you have selected your groups and clicked on View HPI data, the navigation links on the left will show the formats in which you can view the HPI data. Bar Chart shows the data in bar-chart format:
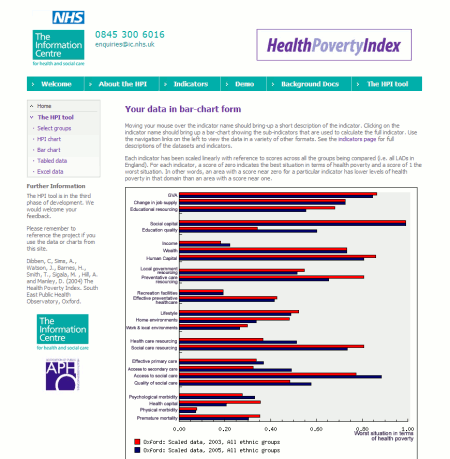
Data for the the main (red bars) and comparison groups (dark blue bars) you defined are shown in the bar-chart, with the 26 health-related indicators shown (see the Indicators or About the HPI pages for further details of the indicators, their components and the datasets used). For each indicator, a score of zero indicates the best situation in terms of health poverty and a score of 1 the worst situation. The main and comparison groups are described at the bottom of the page.
Rolling your mouse over the variable name should bring up a short description of that variable (this is not available in all browsers). By ‘left-clicking’ on the indicators a pop-up chart of the components that make up the indicator will appear.
You can save this chart to reuse in your own documents by saving the image. This varies by web-browser, but typically you can right-click on the chart, and select ‘Save image’. The image will be saved in the common jpeg or png formats, which you can then import into your own documents.
Viewing tabled data
Once you have selected your groups and clicked on View HPI data, the navigation links on the left will show the formats in which you can view the HPI data. Tabled Data shows the data in tabled format:
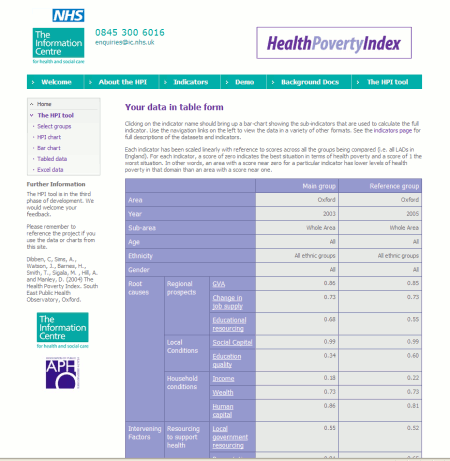
The main and comparison groups you defined are described at the top of the page, followed by a table of the 26 health-related indicators (see the Indicators or About the HPI pages for further details of the indicators, their components and the datasets used).
This data can be reused in your own documents, by copying and pasting the table and data. First highlight the data you are interested in. Second, if you are using Windows, press Ctrl-C to copy the data to the clipboard. Ensure you have a document to put the data into, such as Excel or Word, and press Ctrl-V to paste. Alternatively, if you are using a Unix system, highlighting the data typically copies it, and right-clicking will paste the data into a document. For other systems, consult your documentation.
You can also view the data in Excel format for downloading to your own system - see below for more details on this.
Viewing Excel spreadsheet data
Once you have selected your groups and clicked on View HPI data, the navigation links on the left will show the formats in which you can view the HPI data. Excel Data downloads an Excel format spreadsheet of your data. Your browser should give you the option to open or save the file:
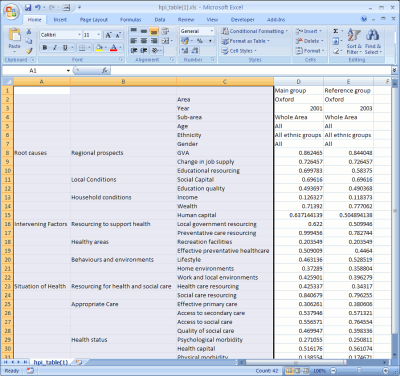
The main and comparison groups you defined are described in the table, followed by the 26 health-related indicators (see the Indicators or About the HPI pages for further details of the indicators, their components and the datasets used).
You can use the Excel format spreadsheet to generate your own graphs of the HPI data, to use in your own documents.
